Knowing your data well is crucial for any statistical analysis. Therefore you should always start by looking at your data graphically and calculating basic descriptive statistics to get an idea of how your data is shaped. First, this post shows how to compute basic descriptive statistics with PROC MEANS. Next, I demonstrate how SAS actually computes these statistical sizes ‘manually’ in SAS/IML.
PROC MEANS
First, we use PROC MEANS to calculate descriptive statistics of the heights of the students in the sashelp.class dataset. I request different common statistical sizes.
proc means data = sashelp.class n max min range Mean Std stderr t prt maxdec=2; var Height; run; |
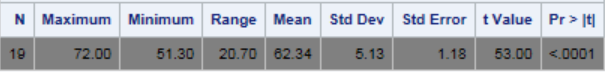
To the right, you can see the result from the Means Procedure. This is a pretty common task for the Means Procedure. These are just a snippet of the many statistical sizes that PROC MEANS produces. Consult the SAS documentation to see them all.
SAS/IML
Next, let us take a look at how SAS actually calculates the statistics from the above step. The calculations in the IML Procedure below yield exactly the same results as above.
proc iml; use sashelp.class; /* Open dataset for reading */ read all var {Height}; /* Read variable Height into vector */ close sashelp.class; /* Close dataset */ mu0 = 60; /* Hypothesised mean */ N = nrow(Height); /* Number of observations */ min = min(Height); /* Minimum Value */ max = max(Height); /* Maximum Value */ range = max - min; /* The difference between min and max */ Mean = 1/n * sum(Height); /* Population mean value */ Std = sqrt(1/(n-1) * sum((Height - Mean)##2)); /* Standard Deviation */ Std_Err = Std / sqrt(n); /* Standard error of the mean */ t_stat = (Mean - mu0) / Std_Err; /* T statistic */ p_value = (1-cdf('t',abs(t_stat),n-1))*2; /* P value associated with t-statistic */ print N max min range Mean Std Std_Err t_stat /* Print selected descriptive statistics */ p_value; quit; |
As you can see from the printed statistics, the values generated are equal to those of the Means Procedure.
Summary
This post demonstrated how to generate simple descriptive statistical sizes in SAS. My usual go-to procedure for descriptive statistics is PROC MEANS. However it depends largely on the problem at hand. Consequently, there are dozens of other options and procedures available. The obvious alternatives are PROC UNIVARIATE, PROC SUMMARY, and PROC FREQ.
When you have calculated descriptive statistics, it is often convenient to save them for later use. See how in the blog post Save Statistics In Macro Variables.
Finally, you can download the entire code from this post here.