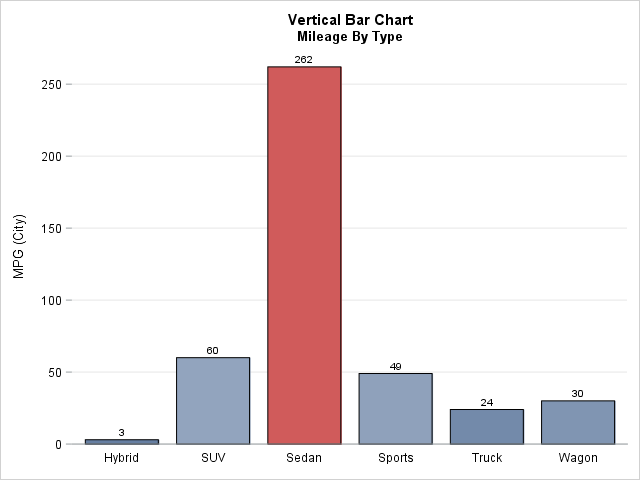
 Here I will present examples primarily using the Statistical Graph procedures in SAS such as PROC SGPLOT, SGPANEL, and SGRENDER. If you are not at all familiar with plots in SAS, go to my Learn SAS Programming section, where I recommend some great introduction learning materials to the SG Procedures. Also, Check out the Getting Started With SGPLOT blog series at Graphically Speaking for a good introduction to the most important of the Statistical Graphs Procedures.
Simple SAS Graphs
Here, I present examples of some very basic graphs that are easy to create with PROC SGPLOT. Obviously there are tons of options and features that you can use to make your graphs look better and more presentable, but in the examples, I will try to limit myself and focus on the very basics.
The examples are all built in the same way. First, I show you the simplest way to draw the graph. Then I add some modifications to enhance the visual aesthetics and simplicity.
Bubble Plot
Highlow Plot
In relation to the graph examples above, see the two blog posts Range Attribute Map in PROC SGPLOT and Discrete Attribute Map in SAS.
Finally, my blog also has a few code examples of graphical and visual analysis in SAS. Go to the Graph category to see them all.
