 Statistical analysis in SAS often requires the use of several SAS procedures and data steps. It is often useful to perform some computation and use the result in the following procedure or data step. For this purpose, you should know how to pass these results or statistics from procedure to procedure (or data step) by saving the computed sizes in macro variables. Below, I present a code example of doing so with Call Symputx.
SAS Code Example
Let us look at a small example, analyzing the Sepal Length – and Width of the Setosa species in the sashelp.iris dataset. First, I calculate the mean of the sepal length and width using PROC MEANS. I then use the OUTPUT OUT= statement to save the results to the data set Stats. In this example, I am only interested in the mean statistic. Therefore, I specify the WHERE=(_STAT_=’MEAN’) option to the output data set. The syntax for how to output statistics to a data set is not the same across procedures. Therefore, you should always consult the SAS Documentation for the relevant procedure. Here, _STAT_ is a variable with the statistical size such as MIN, MAX, STD etc.
/* Compute Setosa mean length and width and save in a dataset */ proc means data=sashelp.iris mean noprint; where Species='Setosa'; var SepalLength SepalWidth; output out=Stats(where=(_STAT_='MEAN')); run; /* Print the output dataset */ proc print data=Stats; run; |
Next, I use a data step to save mean of the sepal length and width in two macro variables. For this purpose, I use the CALL SYMPUTX subroutine. The CALL SYMPUTX subroutine assigns a value to a macro variable from a specified value or variable. The difference between CALL SYMPUTX and CALL SYMPUT is that CALL SYMPUTX removes both leading and trailing blanks. Recall that when DATA _NULL_ is specified in the data step we do not create an actual data set. This lets us use data and perform calculations without creating a data set, we do not need.
/* Save relevant statistics in macro variables */ data _null_; set Stats; call symputx('MeanLength', SepalLength); call symputx('MeanWidth', SepalWidth); run; |
Plot the Results
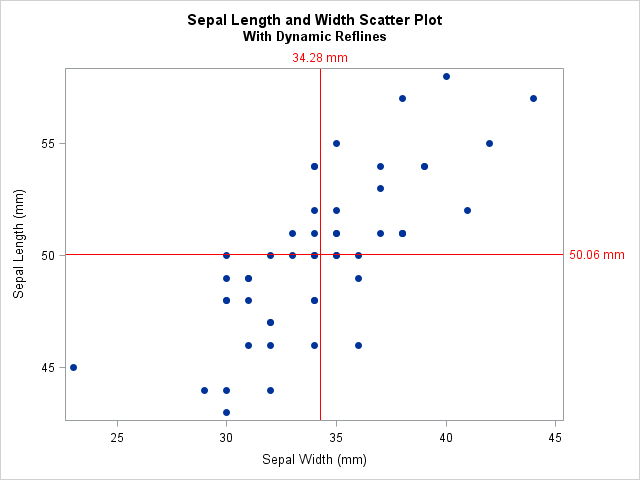
Finally, I create a scatter plot of the Setosa length against width. In this scatter plot, I want to highlight the mean of the sepal length and the mean of the sepal width in the graph. I could look at the output from the Means procedure above, but I already used the outputted data set from PROC MEANS and saved the statistics in macro variables above. Consequently, I can use the macro variables to smoothly highlight the location of the means using the REFLINE Statements in PROC SGPLOT as in the code below.
/* Plot scatterplot of Setosa length against width with reflines using calculated statistics */ title 'Sepal Length and Width Scatter Plot'; title2 'With Dynamic Reflines'; proc sgplot data=sashelp.iris; where Species='Setosa'; scatter x=SepalWidth y=SepalLength / markerattrs=(symbol=circlefilled); refline &MeanLength / axis=y lineattrs=(color=red) label="&MeanLength mm" labelattrs=(color=red); refline &MeanWidth / axis=x lineattrs=(color=red) label="&MeanWidth mm" labelattrs=(color=red); run; title; |
Summary
Saving statistics in macro variables for later analysis is a simple, but very powerful tool in SAS. This way, you do not limit yourself to performing your entire analysis in one procedure or data step. It enables you to use several procedures and make them work together for a much more smooth and robust analysis.
In the blog post Calculate Descriptive Statistics In SAS, I demonstrate several procedures to calculate basic statistics. Also, read the related post Select Into Multiple Macro Variables in SAS Proc SQL.
You can download the entire code from this blog post here.