 The legend of a SAS plot is an important piece of information, that quickly gives you an overview of the elements in the plot. Therefore, you should aim for control in PROC SGPLOT. This post demonstrates 5 small tips to take control over the legend in PROC SGPLOT with small code examples.
Position, Location and Appearance
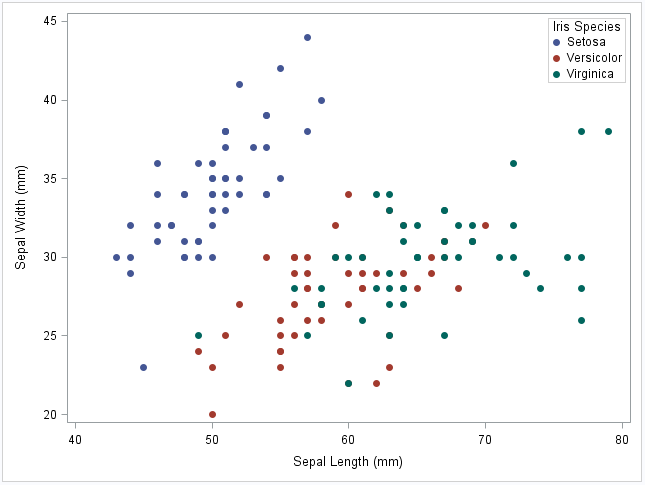
re we think about what to put in the legend, first we should consider the basics. Where do you want the legend to appear in the plot? You can control this with the Keylegend Statement. In the code below, I use three options to control the overall appearance of the legend
- Location=Inside: Controls that the legend appears inside the actual plot (inside the inner border).
- Position=NE: Controls that the legend appears in the upper right (North West) corner.
- Across=1: Controls that the items in the legend appear over each other and not side by side.
proc sgplot data=sashelp.iris noautolegend; styleattrs datasymbols=(circlefilled squarefilled starfilled); scatter x=sepallength y=sepalwidth / group=species; keylegend / location=inside position=NE across=1; run; |
Plot References
Next let us look at how to control from which statements in PROC SGPLOT we want to include items in the legend from. Consider the code below. Here, I draw a scatter plot like above and a regression plot with the Reg Statement. Suppose we only want to include the scatter items in the legend. Not the Regression lines as they are self-explanatory. I can do so with plot references. In both the Scatter and the Reg Statement, I use the Name= Option and give each plot reference a name. I use this reference in the Keylegend Statement to include only items from the Scatter Statement in the legend. Not the Reg Statement.
proc sgplot data=sashelp.iris noautolegend; styleattrs datasymbols=(circlefilled squarefilled starfilled); scatter x=sepallength y=sepalwidth / group=species name='scatter'; reg x=sepallength y=sepalwidth / group=species name='reg'; keylegend 'scatter' / location=inside position=NE across=1; run; |
Exclude Groups in the Legend
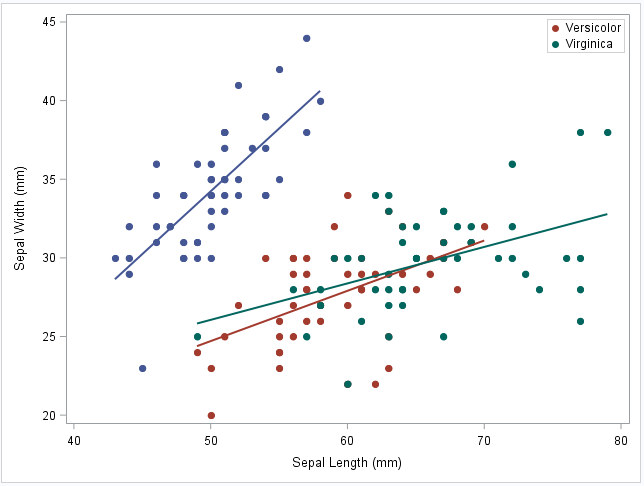
Suppose there are specific groups in the data that I do not want to appear in the legend. From SAS version 9.4M3, I can use the Exclude Option to exclude specific groups of data. Consider the code below. Here, I exclude the group ‘Setosa’ from the legend. Bear in mind though, that this applies only to the legend. Not the rest of the plot.
proc sgplot data=sashelp.iris noautolegend; styleattrs datasymbols=(circlefilled squarefilled starfilled); scatter x=sepallength y=sepalwidth / group=species name='scatter'; reg x=sepallength y=sepalwidth / group=species name='reg'; keylegend 'scatter' / location=inside position=NE across=1 exclude=('Setosa'); run; |
You can see the result below. The Setosa item is now removed.
The Legenditem Statement
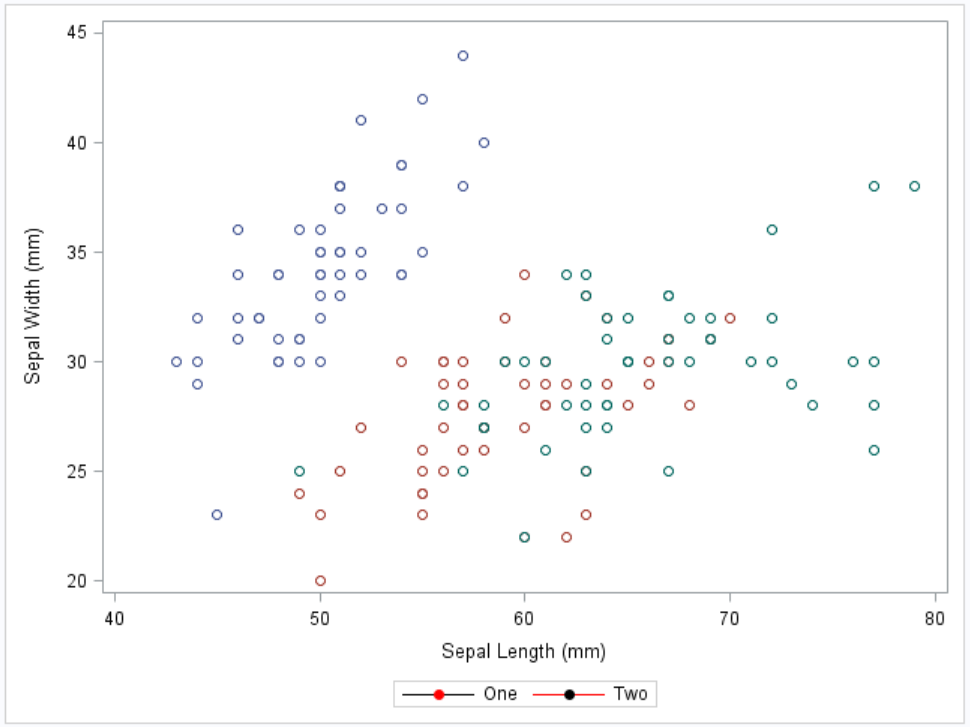
From Sas version 9.4M5, you can use the Legentitem Statement. To me, the legenditem statement offers the ultimate control over what items to display. Consider the code below. The Legenditem Statement requires two options: A type and a name. Below, I specify type=markerline in both Legenditem Statements. I give each legenditem its own name in the name=option. Finally, I reference these two names in the following Keylegend Statement. In the options after the dash, I can specify all kinds of options to alter the appearance of that specific legend item. I encourage you to play around with this feature. It is quite handy.
proc sgplot data=sashelp.iris noautolegend; scatter x=sepallength y=sepalwidth / group=species; legenditem type=markerline name='item1' / label="One" lineattrs=(pattern=Solid color=black) markerattrs=(symbol=circlefilled color=red); legenditem type=markerline name='item2' / label="Two" lineattrs=(pattern=Solid color=red) markerattrs=(symbol=circlefilled color=black); keylegend 'item1' 'item2'; run; |
As you can see below, we control the appearance of each item with the legenditem statement.
Multiple Legends in One Plot
We are not limited to a single legend in PROC SGPLOT. Combining a few of the tips above, we can easily specify two Keylegend Statements and reference either plots or items directly in them. See an example below.
proc sgplot data=sashelp.iris noautolegend; scatter x=sepallength y=sepalwidth / group=species; legenditem type=markerline name='item1' / label="One" lineattrs=(pattern=Solid color=black) markerattrs=(symbol=circlefilled color=red); legenditem type=markerline name='item2' / label="Two" lineattrs=(pattern=Solid color=red) markerattrs=(symbol=circlefilled color=black); keylegend 'item1' / position=NE; keylegend 'item2' / position=SW; run; |
Summary
In this post, we have seen how to take control over the legend in PROC SGPLOT with 5 tips that are easy to replicate in any SAS plot. We have seen that we can include and exclude the items we want and that we can place and form the legend to our liking. I highly encourage you to play around with the different statements and options we use in the examples and use the documentation when you do not understand the results.
See the Graph Section of my site to see more plot examples. Also, be sure to follow the great blog Graphically Speaking. Tons of examples to follow there. For other graph posts, see The Range Attribute Map in SAS SGPLOT and The Discrete Attribute Map in SAS Proc SGPLOT.
You can download the entire SAS code from this post here.