A line or series plot is commonly used when we want to visualize how values evolve over time. You will often see such charts visualizing stock prices, indexes and so on. Here, I demonstrate how to create line plots in SAS with PROC SGPLOT by example. First, I will create a simple line plot in SAS. Then, I will demonstrate how to alter the visual aspects of the plot with the may statements and options available.
A Simple Line Plot in SAS
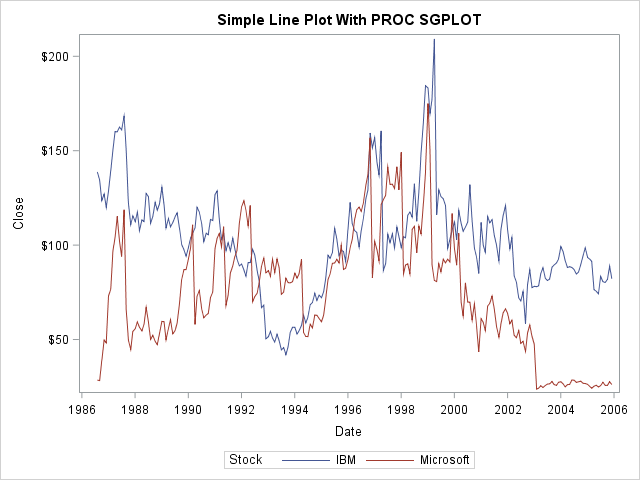
First, let us create a simple series plot in SAS with PROC SGPLOT. I use the Sashelp.Stocks data set for this purpose. For simplicity, I limit it to ‘IBM’ and ‘Microsoft’. I use the Series Statement to create the line plot. I set x=date and y=close. Finally, I use the Group=Stock Option to draw separate lines for each stock in the data. You can see the result from this example below.
title "Simple Line Plot With PROC SGPLOT"; proc sgplot data=sashelp.stocks; where stock in ('IBM', 'Microsoft'); series x=date y=close / group=stock; run; title; |
Result:
Modifying the PROC SGPLOT Code
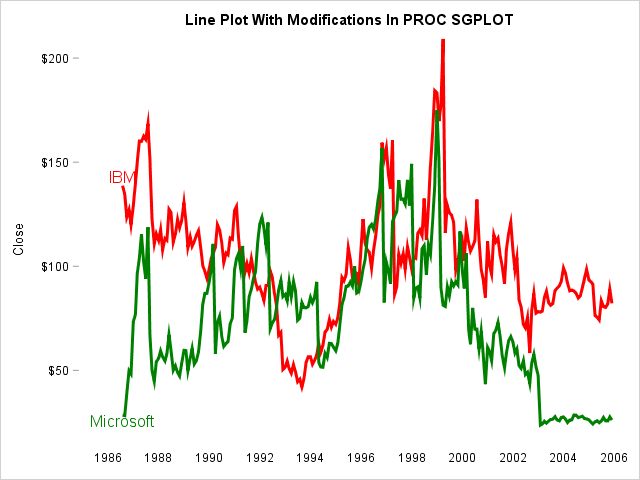
Now, let us modify the SAS code from above and alter the plot. In the Proc Statement, I use the Noborder Option to get rid of the border around the plot. I use the Styleattrs Statement to control what colors the groups should switch between. In this case, I want red and green.
Besides Group=, there are dozens of options to use in the SAS Series Statement. I use the lineattrs= to specify the thickness of the lines. Also, I use the Curvelabelattrs to set the size of the curvelabels. Setting this option makes labels appear next to the curves. This makes the key legend redundant. I commented it out in the code below. Which one you prefer is up to you. Finally, I use the Xaxis and Yaxis Statements to get rid of redundant chart junk like lines and ticks. You can see the result from this example below.
title "Line Plot With Modifications In PROC SGPLOT"; proc sgplot data=sashelp.stocks noborder; where stock in ('IBM', 'Microsoft'); styleattrs datacontrastcolors=(red green); series x=date y=close / curvelabel curvelabelattrs=(size=12) group=stock lineattrs=(thickness=3); /* keylegend / location=inside position=NE across=1; */ xaxis display=(nolabel noline noticks); yaxis display=(noline); run; title; |
Result:
Summary
In this post, we investigated the line plot in SAS with PROC SGPLOT. We see that it is easy to create a simple line plot with the Series Statement. Also, we can alter the plot to our liking with various statements and options in the SAS SGPLOT Procedure. I encourage you to browse the Documentation and familiarize yourself with the many options.
For related example pages, see A Scatter Plot in SAS with PROC SGPLOT, Bar Chart with PROC SGPLOT and Histograms In SAS with PROC SGPLOT.
You can download the entire SAS code from this page here.