In the post, Moving Average in SAS with PROC EXPAND, I demonstrate how to use PROC EXPAND to create a moving average in SAS. The PROC EXPAND approach is nice to create rolling statistics by group. However, it has only predefined statistics available. In this post, I will demonstrate how to create custom rolling statistics in SAS with PROC SQL by example.
First of all, I will use the Sashelp.Stocks data set in the following examples. Below, I create a copy of the data set. I sort the data set by Stock and Date to make the process easier to understand.
proc sort data=sashelp.stocks out=stocks; by stock date; run; |
In the examples to come, I will not explain in depth how the code actually works. Rather, I briefly explain the approach and let the code be basic templates that can build most rolling statistics if you edit it correctly.
Moving Average Example with PROC SQL
 First, let us see an example of how to create a simple moving average with PROC SQL in SAS. In the code below, I first select all the variables from the example data set above. I select these variables from stocks, where I use the alias a in the From Clause at the bottom.
Next, I use a nested subquery to create the moving average. Here, I read data from the same data set, stocks and compare values to the stocks data set with the alias a.
In the subquery, there are three clauses that are equally important:
- First off, In the select clause, I simply specify the statistic I want. In this case, I want to calculate an average.
- In the first where condition, I specify stock=a.stock. This may not seem intuitive at first. However, this simply ensures that the values that are compared are within the same By-Groups.
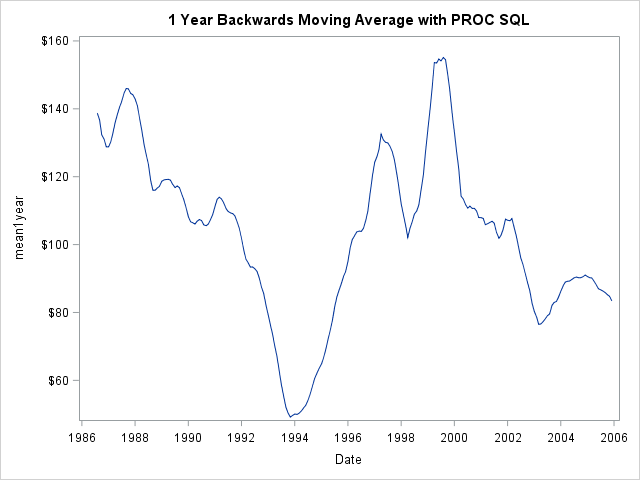
- Finally, in the second where condition, I specify that the Date values read in the subquery should be within the last year of the date values in the stocks data set with the alias a.
The result is a one year backwards moving average. You can see the plot to the right. It is not hard to edit the code to create other periods or statistics instead.
proc sql; create table test1 as select *, (select mean(close) from stocks where stock=a.stock and (intnx('month', a.Date, -11, 'b') le Date le a.Date)) as mean1year format=dollar8.2 from stocks as a; quit; |
Rolling Count Example with SAS PROC SQL
Next, I use the same SAS PROC SQL template to create a rolling count. Here, I use the N Function to count how many observations have a close price of over 100 in the last year.
proc sql; create table test2 as select *, (select n(close) from stocks where stock=a.stock and (intnx('month', a.Date, -11, 'b') le Date le a.Date and close > 100)) as countover100 from stocks as a; quit; |
The code in the two examples is quite similar. I encourage you to play around with this approach and create other rolling statistics with different time periods. It does not take much editing.
Summary
In this post, I demonstrate by example how to create rolling statistics with PROC SQL in SAS. I show how to create moving averages and counts and discuss why the approach of nested subqueries work. As an extra advantage, the data does not even have to be sorted by the appropriate groups in advance. I only sort the data in the examples here to make the result easier to understand.
For PROC SQL related posts, see Create Cartesian Products in SAS with PROC SQL and the Data Step, Using the _Method Option in PROC SQL and Create Custom Sort Order in SAS.
You can download the entire code from this post here.